This dataset contains 4 tables, in CSV format:
- The Products table contains the 35 products sold at Maven Toys (each record represents one product), with fields containing details about the product category, cost, and retail price
- The Stores table contains the 50 Maven Toys store locations (each record represents one store), with fields containing details about the store location, type, and date it opened
- The Sales table contains the units sold in over 800,000 sales transactions from January 2017 to October 2018 (each record represents the purchase of a specific product at a specific store on a specific date)
- The Inventory table contains over 1,500 records that represent the stock on hand of each product in each store at the current point in time (Oct 1, 2018)
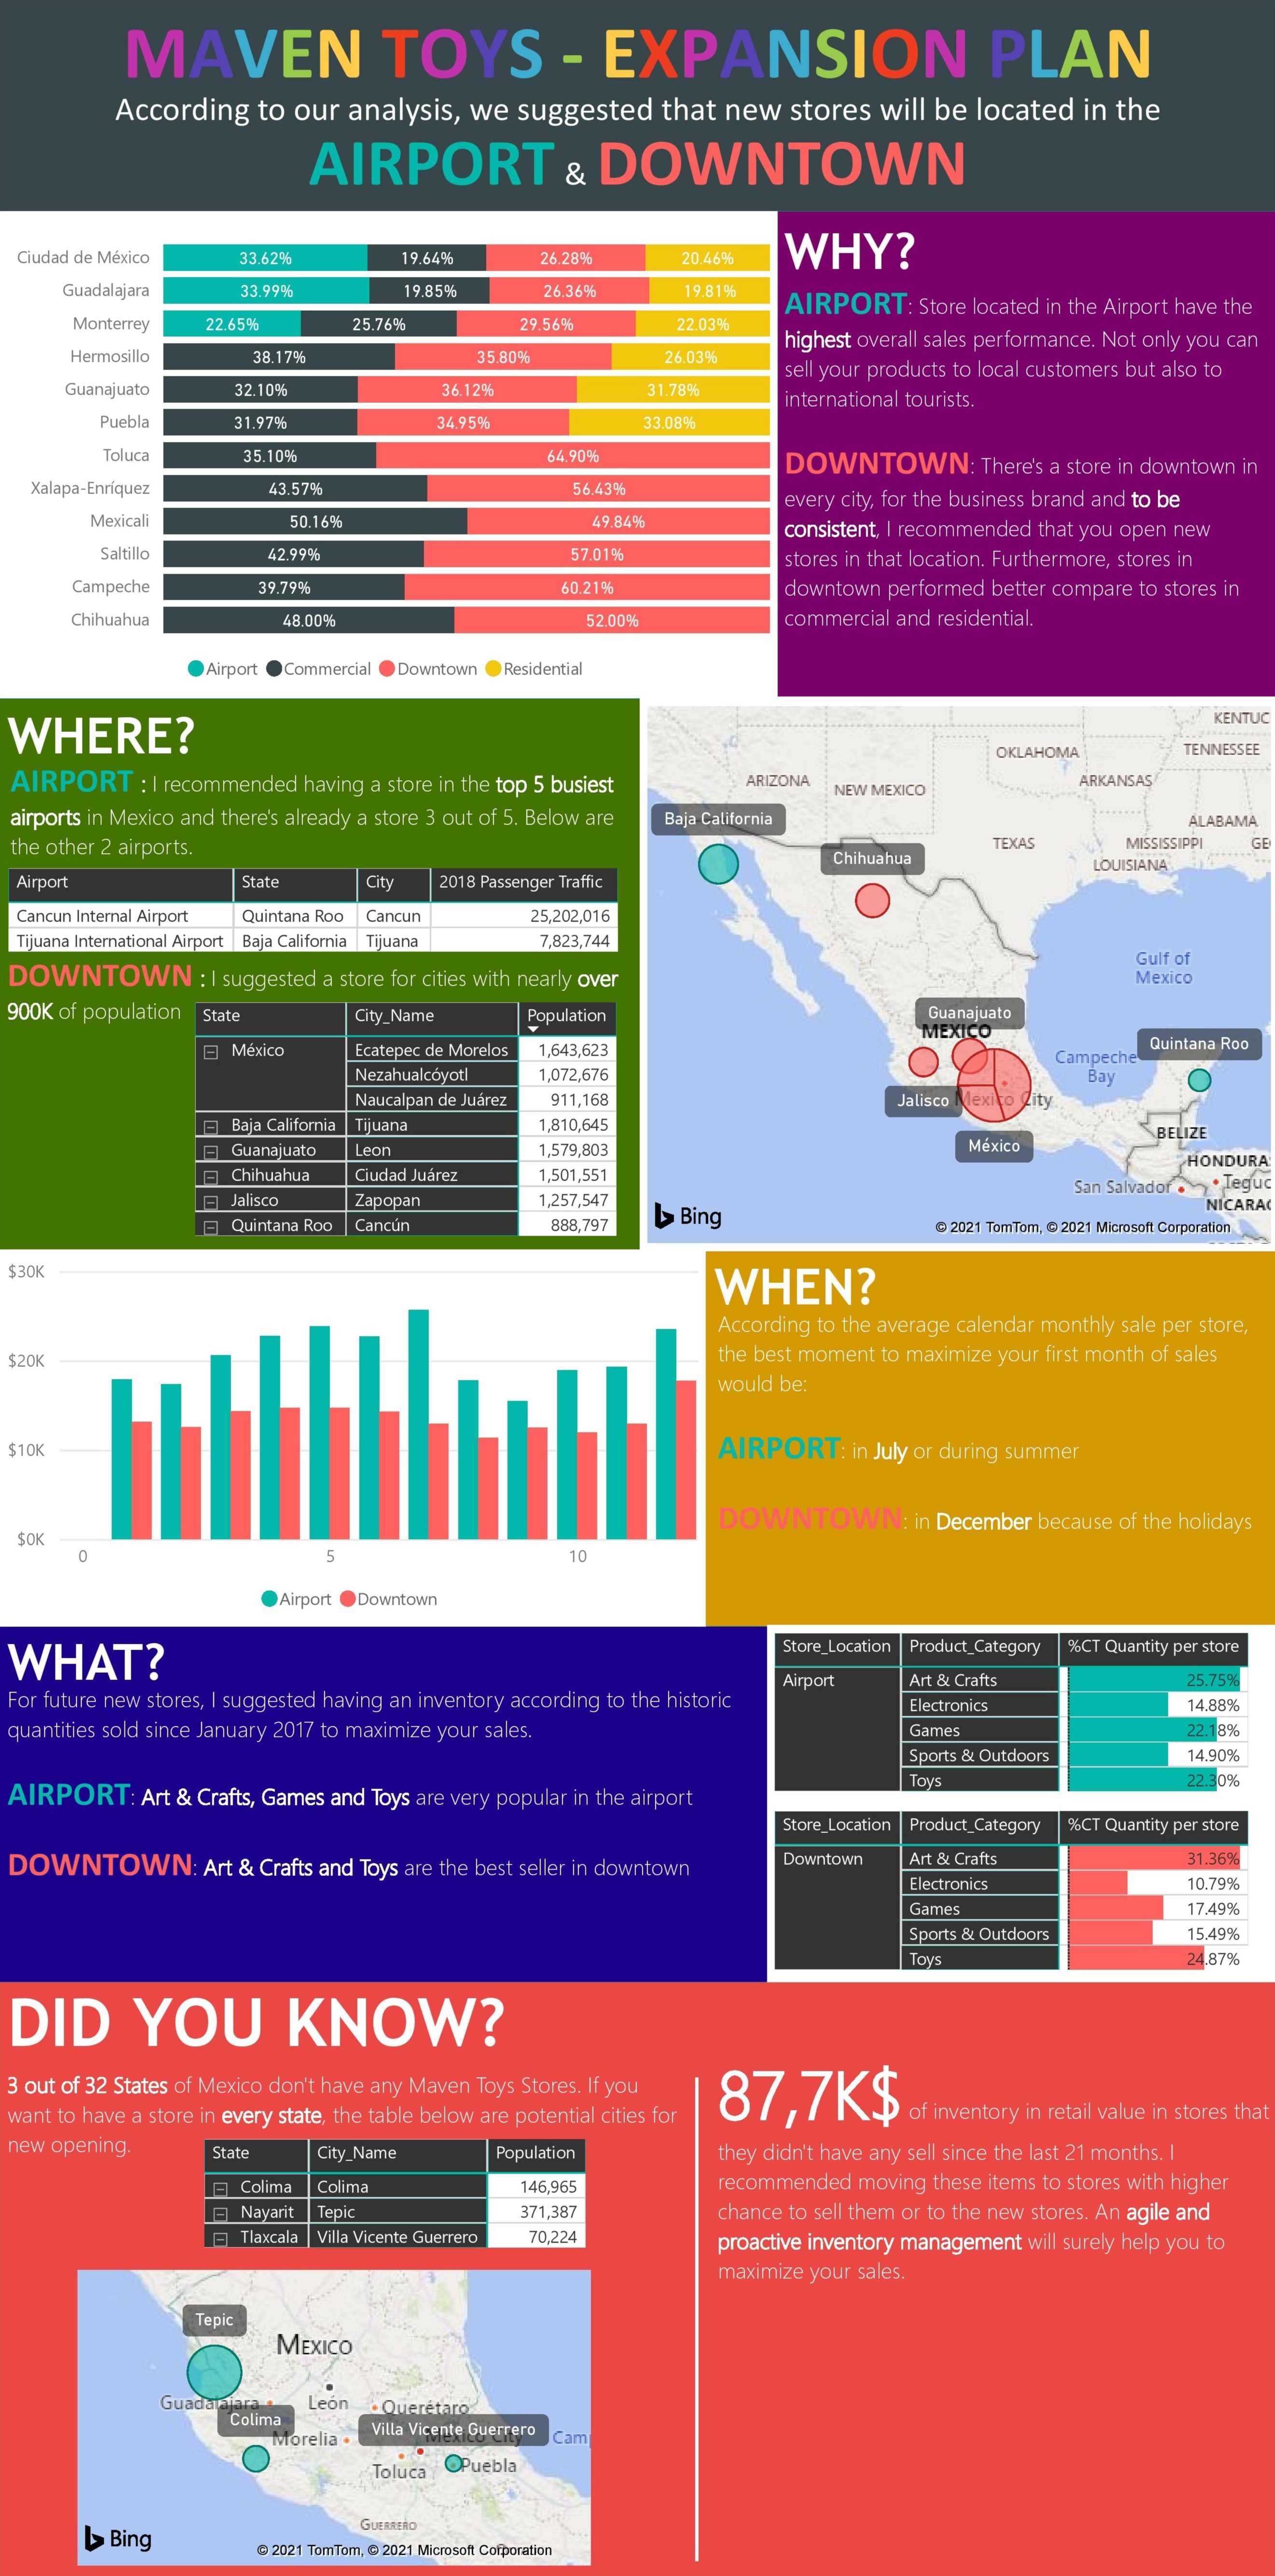
For the Maven Toys Challenge, I will be assuming the role of a BI consultant that has just been hired by Maven Toys. As they look to expand their business with new stores, they've brought me in to analyze interesting patterns and trends in their data and help them make informed decisions.
Dataset: Excel CSV files
Dataset source link: https://www.mavenanalytics.io/data-playground