Generated in Microsoft Excel
Dataset: Microsoft Excel and Excel CSV
Dataset source : All content are fictional data and generated in Excel.
Dataset: Microsoft Excel and Excel CSV
Dataset source : All content are fictional data and generated in Excel.
To make this case realistic, several data are imported into MySQL.
1 - Data Sales (200,000+ transactions)
2 - List of clients
3 - Type of membership list
4 - Product list with unit sale and cost
5 - List of US States
My goal is to develop several dynamic dashboards for different managers of the organization. Power Query, Power Pivot and DAX was used to build this report in Power BI.
It's linked directly to the MySQL Database. More tables and data in Excel was added into the tool to answer several requests from different managers.

The company started to sell online since the 1st of December 2019.
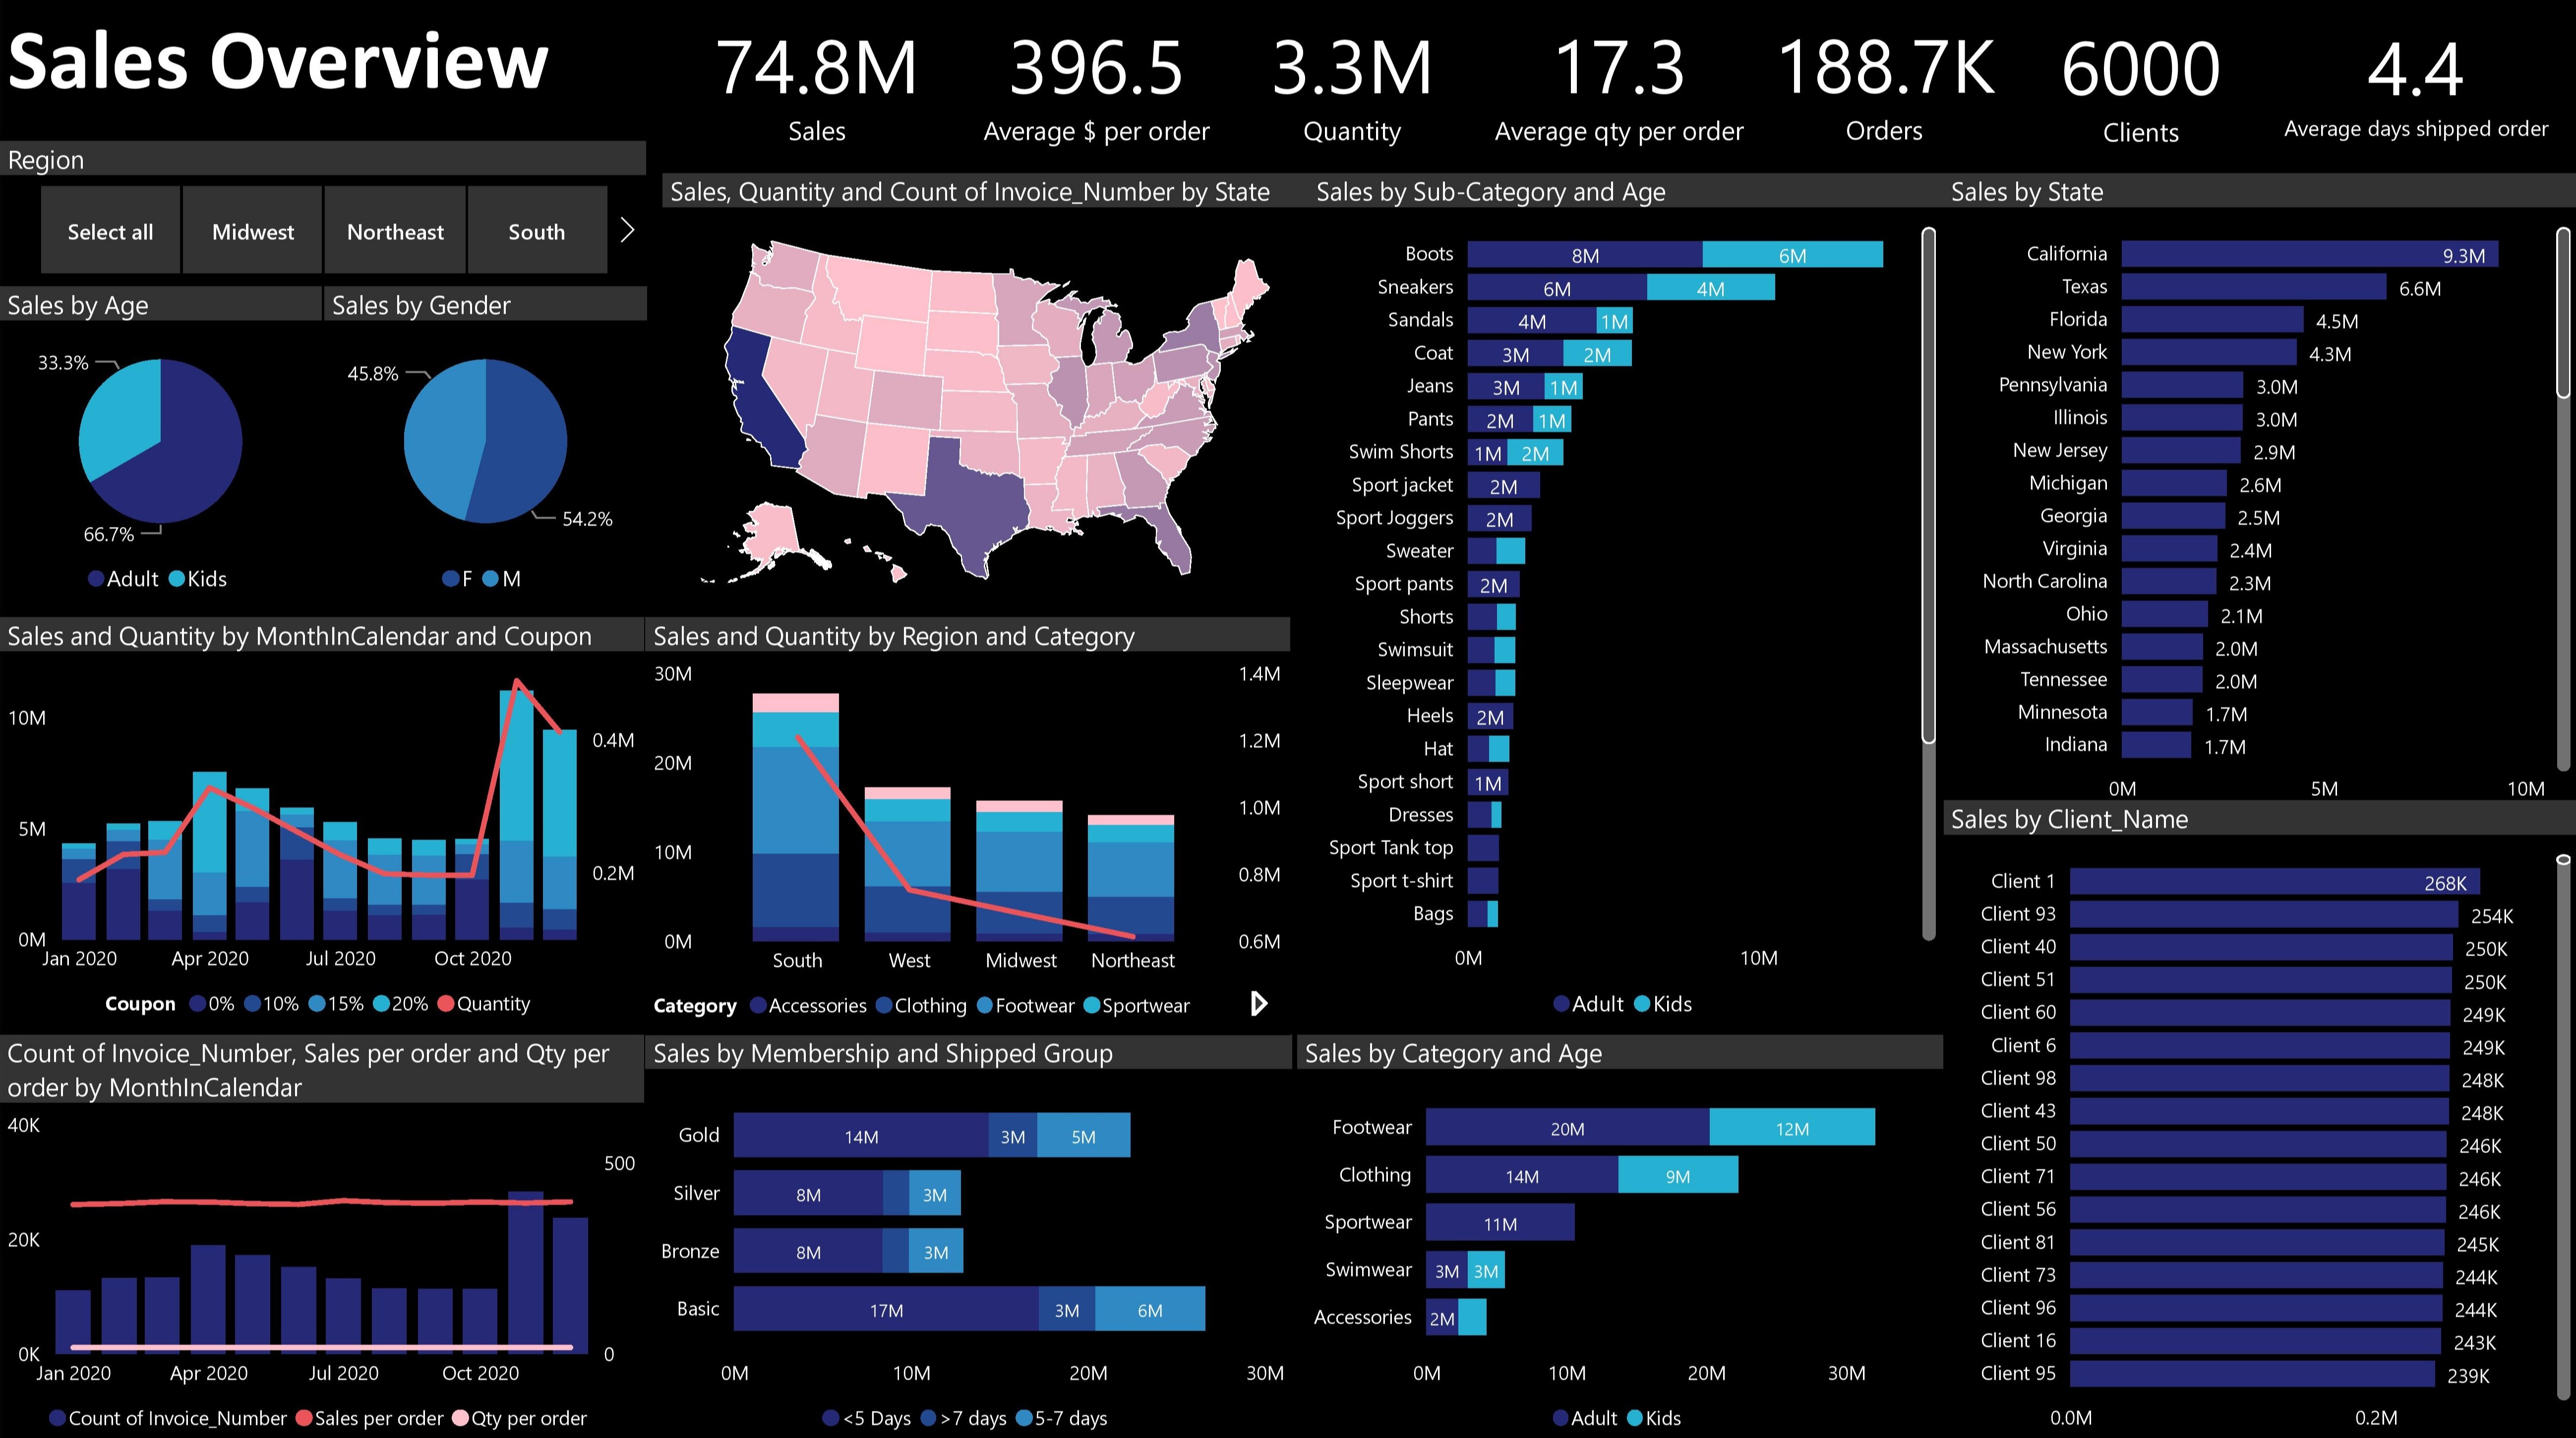
I've been ask to develop real-time data visualizations for the year of 2020 for the online sales.
Challenge
In a short time, IT department won't develop the scripts to automatically pull all the data from the websites which will included all the financial details of each transaction.
So my other option was to use the warehouse dataset but with limited information.
I logged to the SQL dataset and the data are:
- Date_Order
- Date_Shipped
- ClienID
- Invoice_Number
- ProductID
- Coupon
- Quantity
Depending on the marketing campaign, the coupon given are 20%, 15% or 10% off.
Furthermore, the company offered discount of 10%, 8% and 5% according of the customer's membership.
Me
I emailed the sales manager and exec that the dashboard is completed and will be able to monitor in real-time the sales from online.
Customer Support Manager:
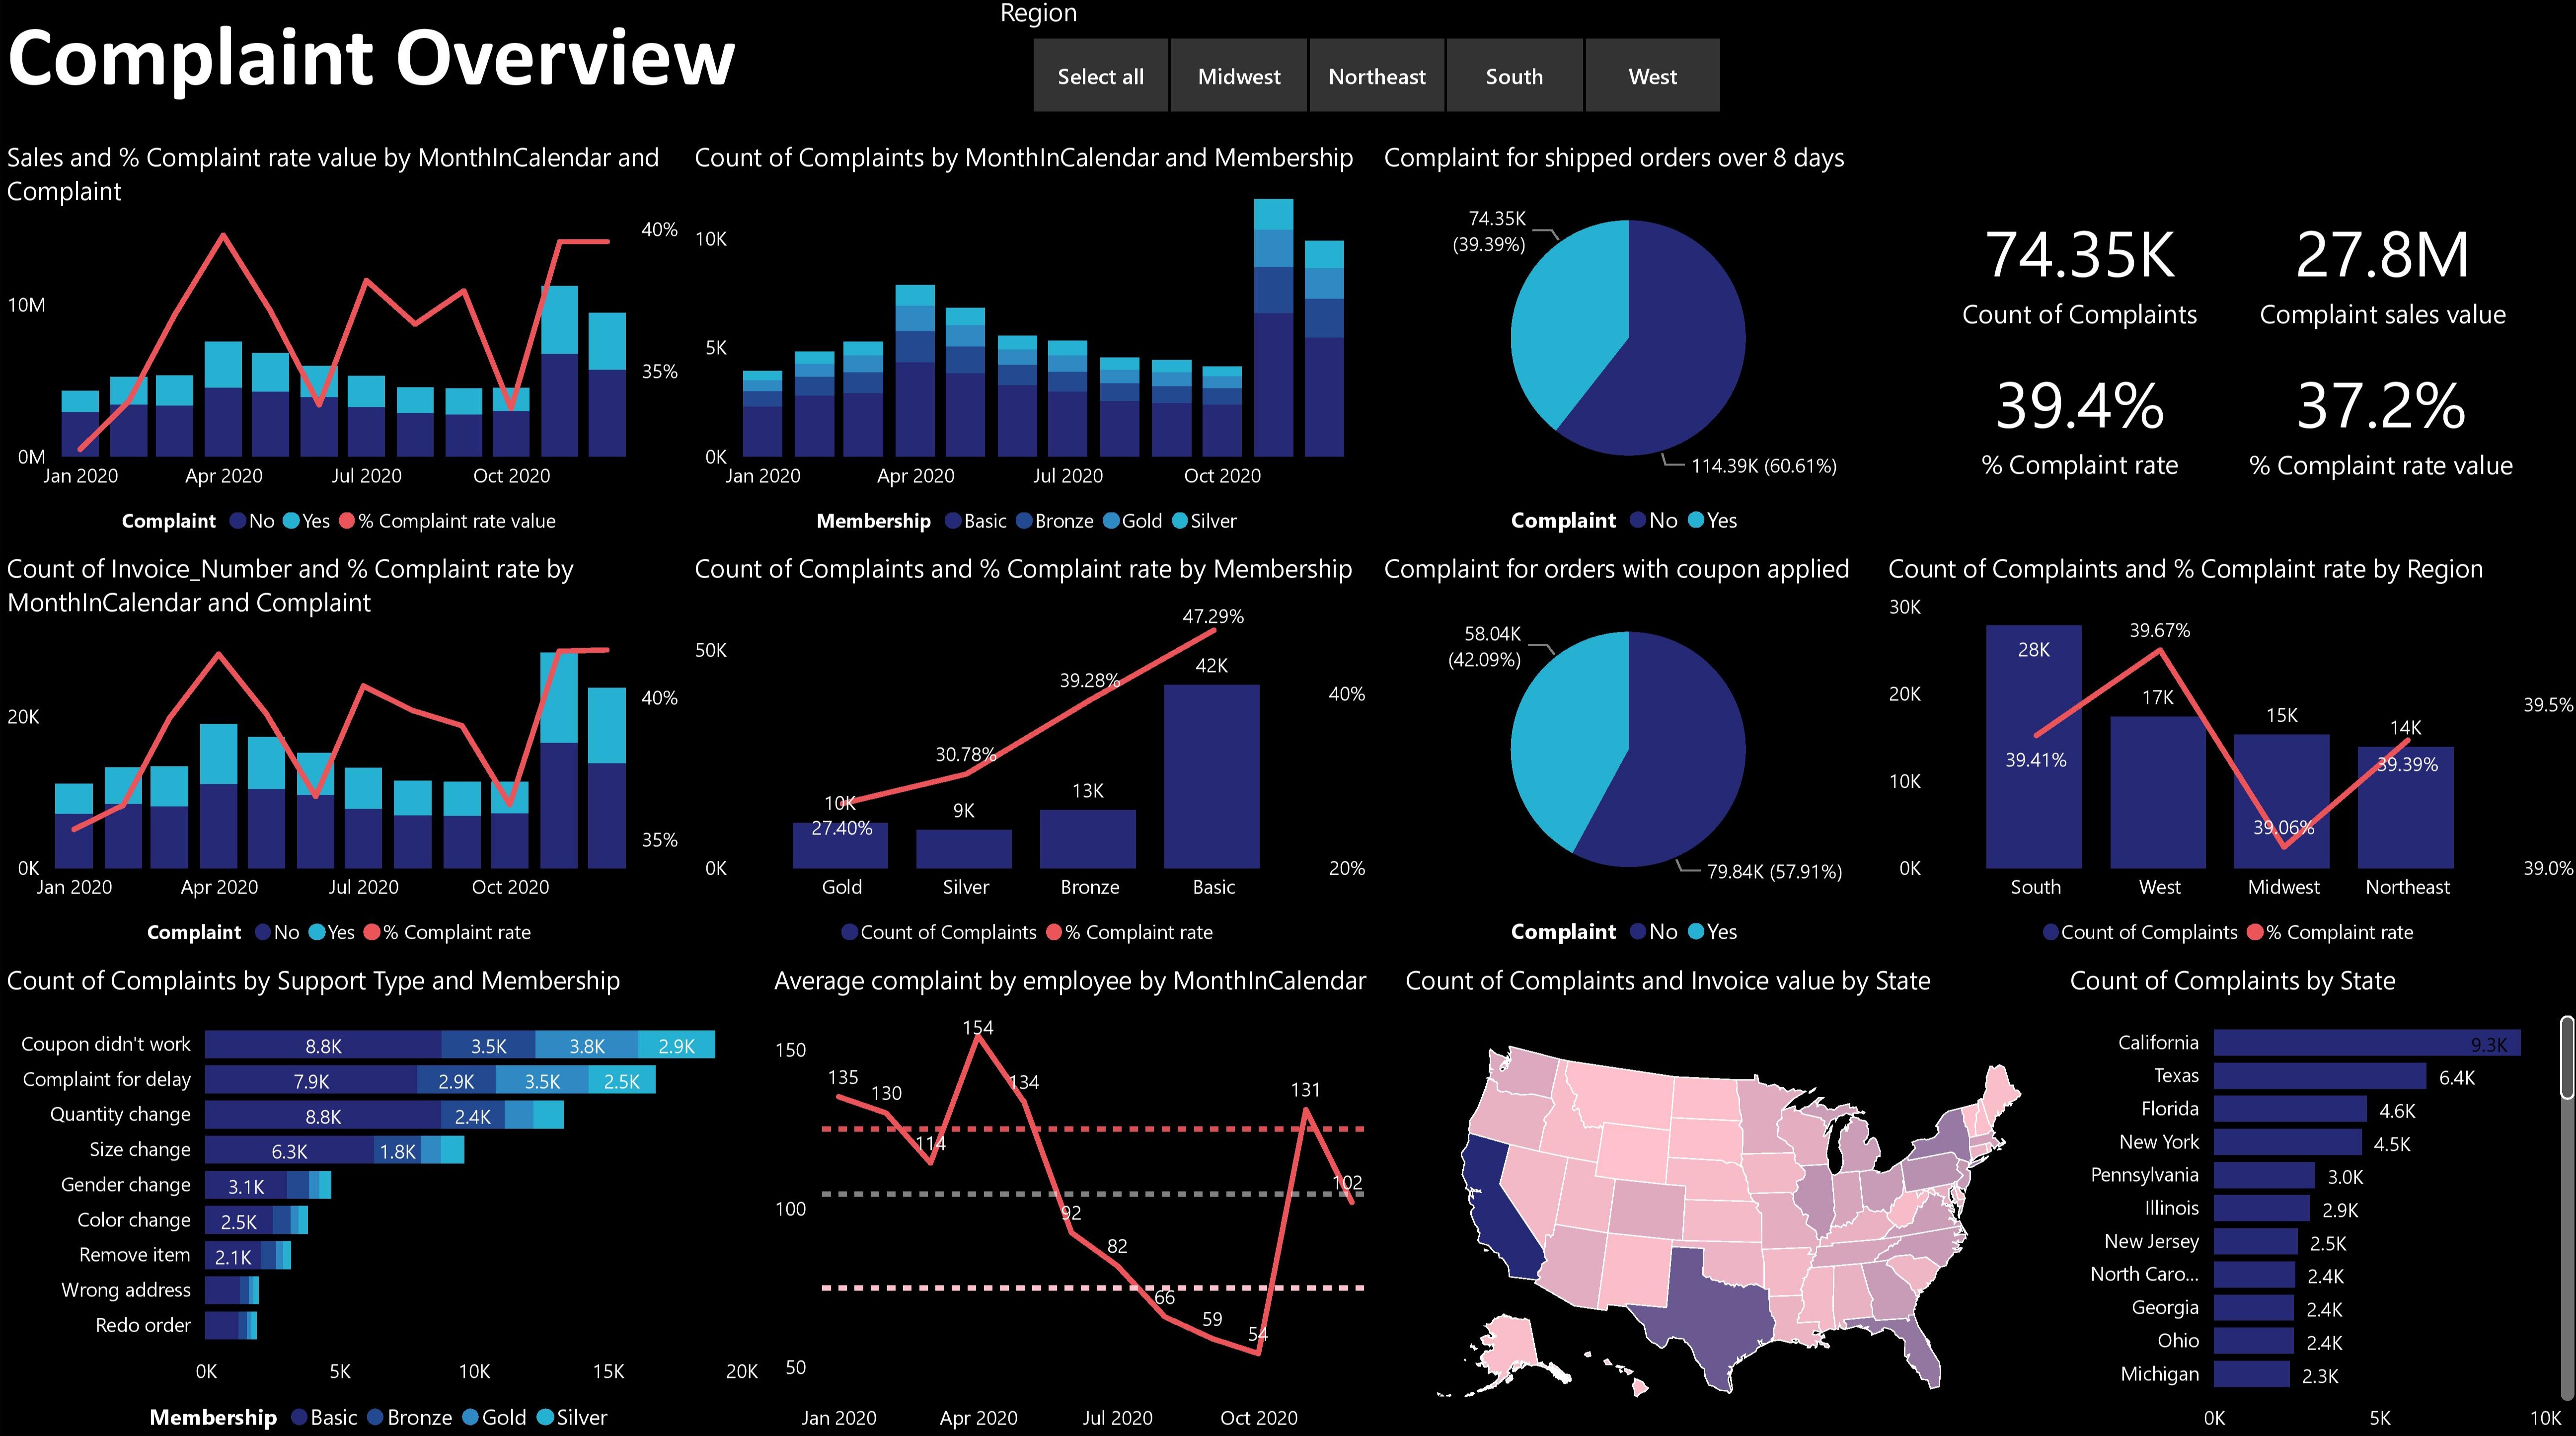
The Customer Support manager found that there's a lot of complaint from the online sales. There will be a moment where his team won't be able to respond promptly because of the high volume of phone call and email to answer.
On a monthly basis, his team sended me a table with only the Invoice_Number and Support_Type
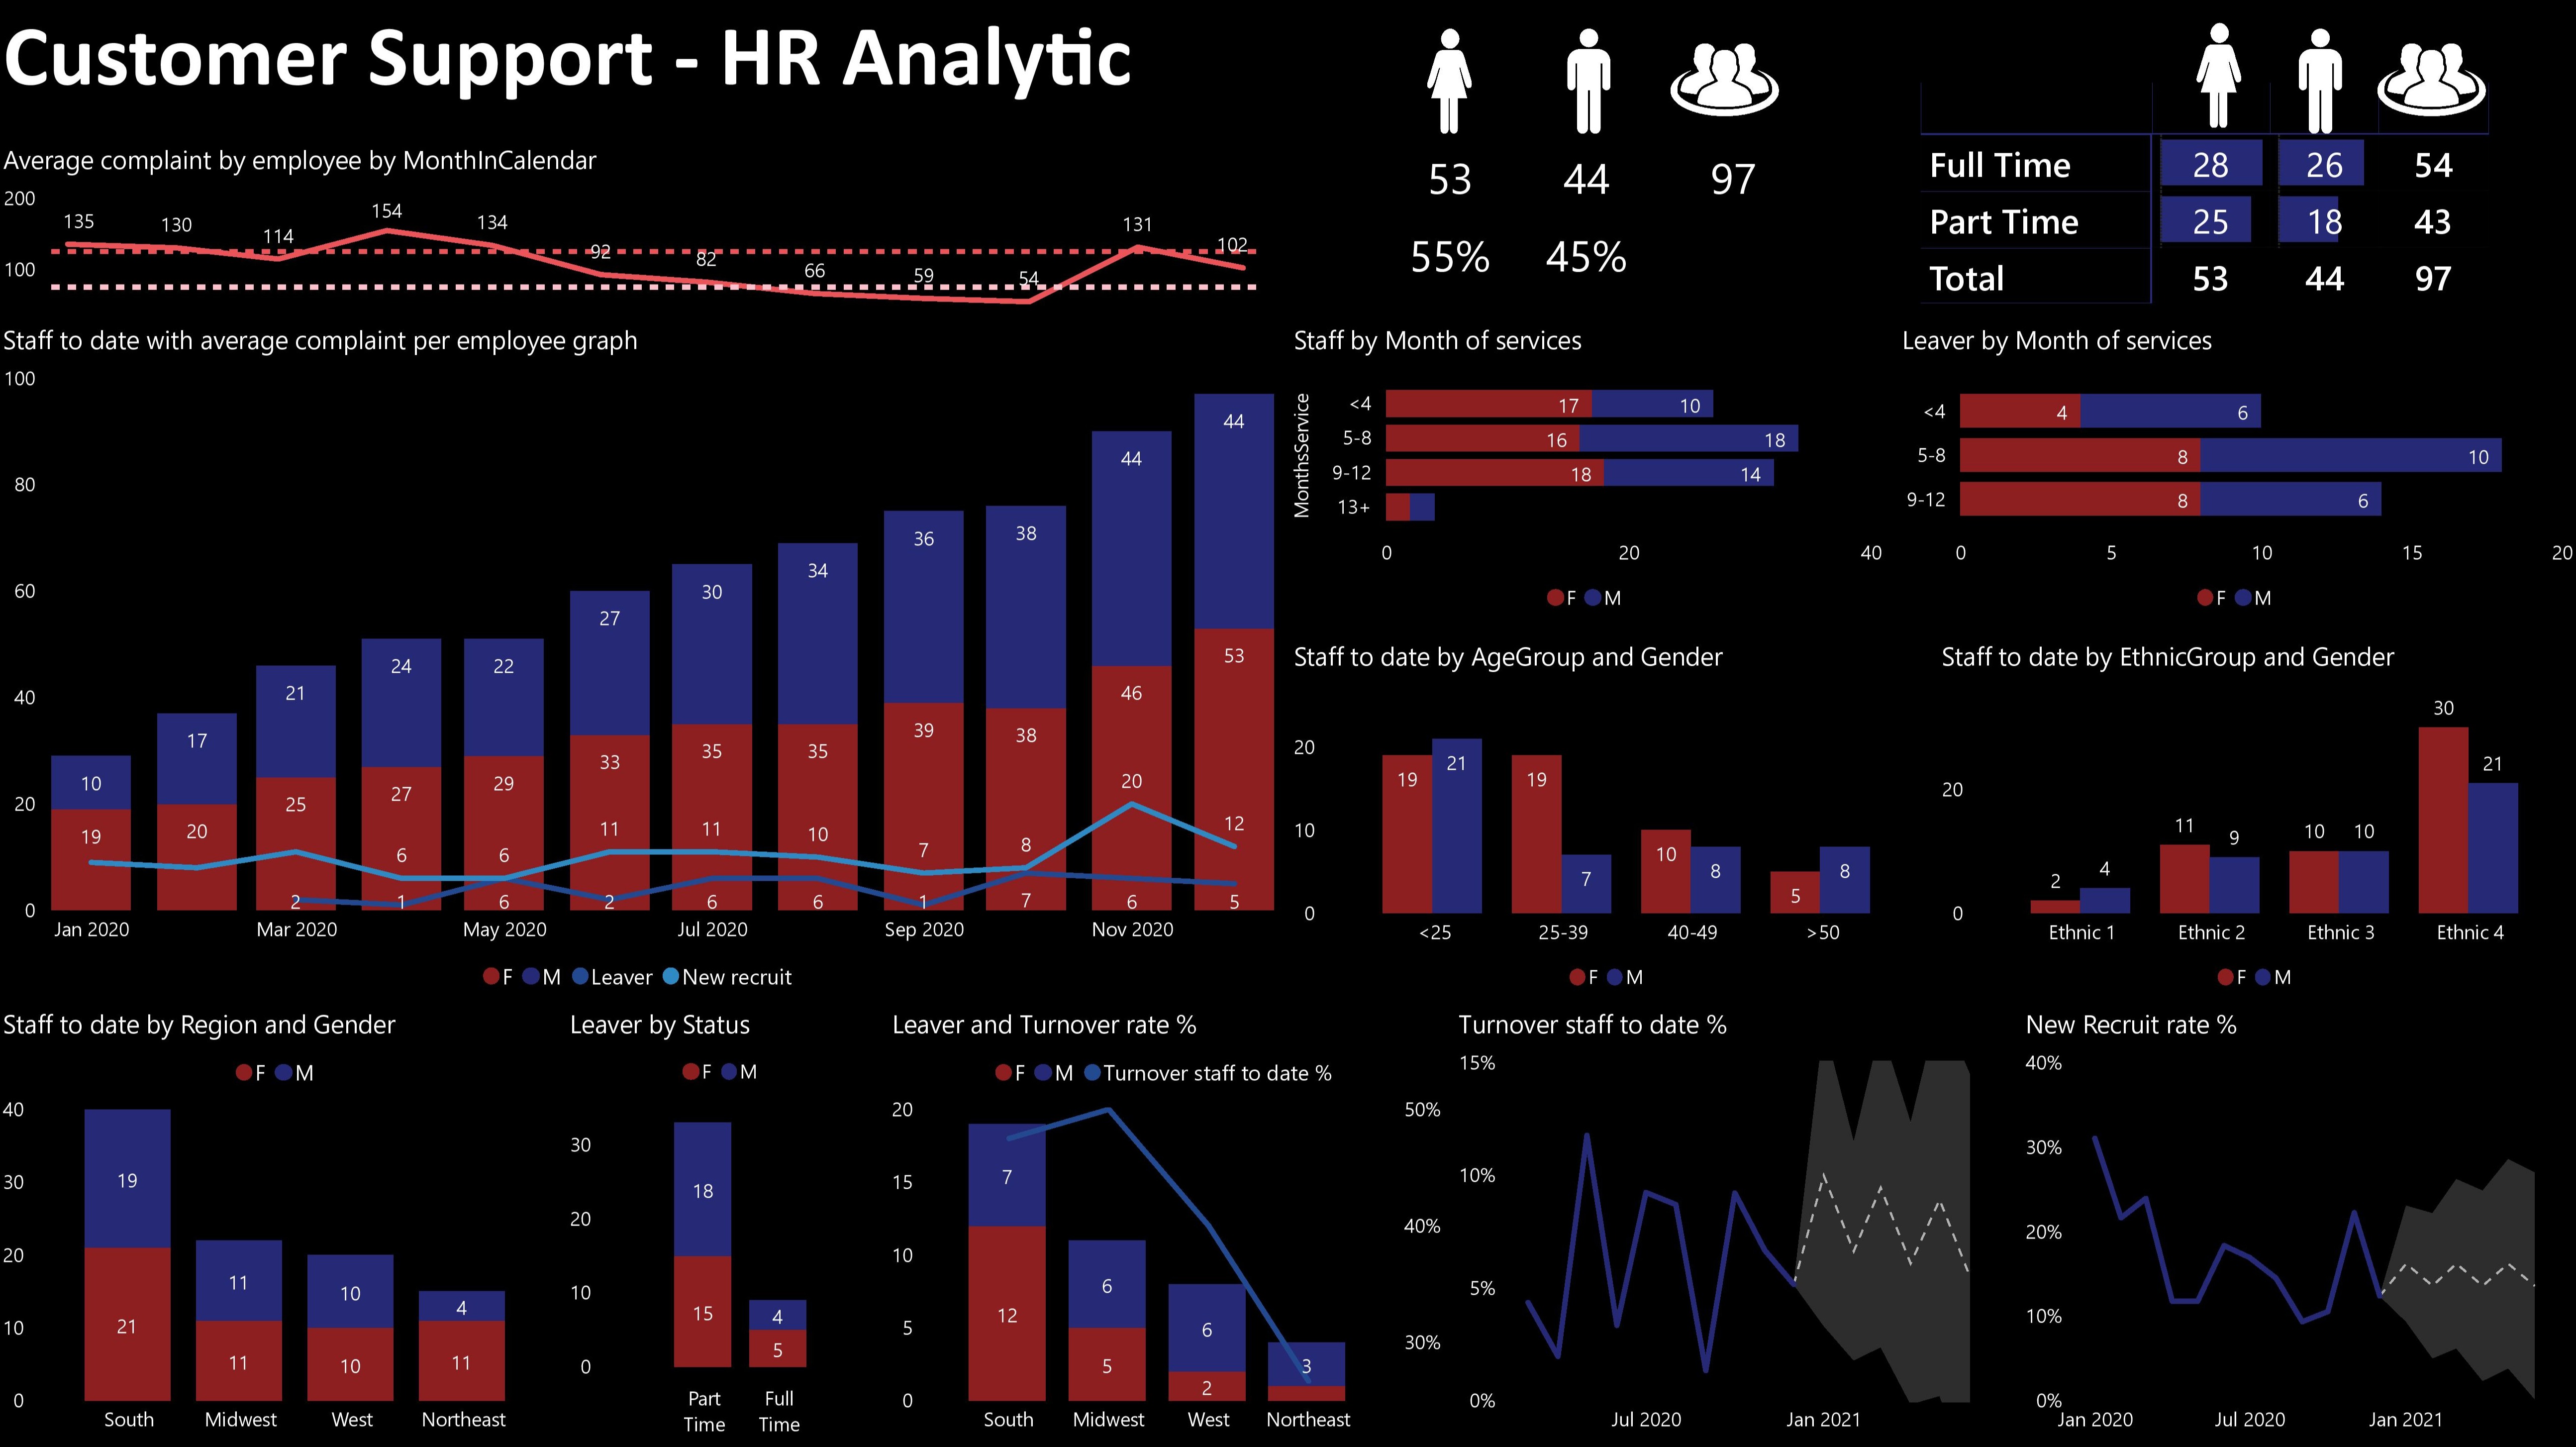
At the same time, he would like to have an insight of his department as it's will help him to effectively manage his team.
Me:
I shared the 2 dashboards as requested.
A graph is provided to alert him when the number of complaint per employee is above 125 which help him to manage his department as he felt that the beginning of the year, the number of complaints for online sales was quite high.
Because of confidentiality policy, I can't have access to the HR dataset. HR department provided me on a monthly basis the list of hiring and leaving by email in an Excel sheet.
Marketing:
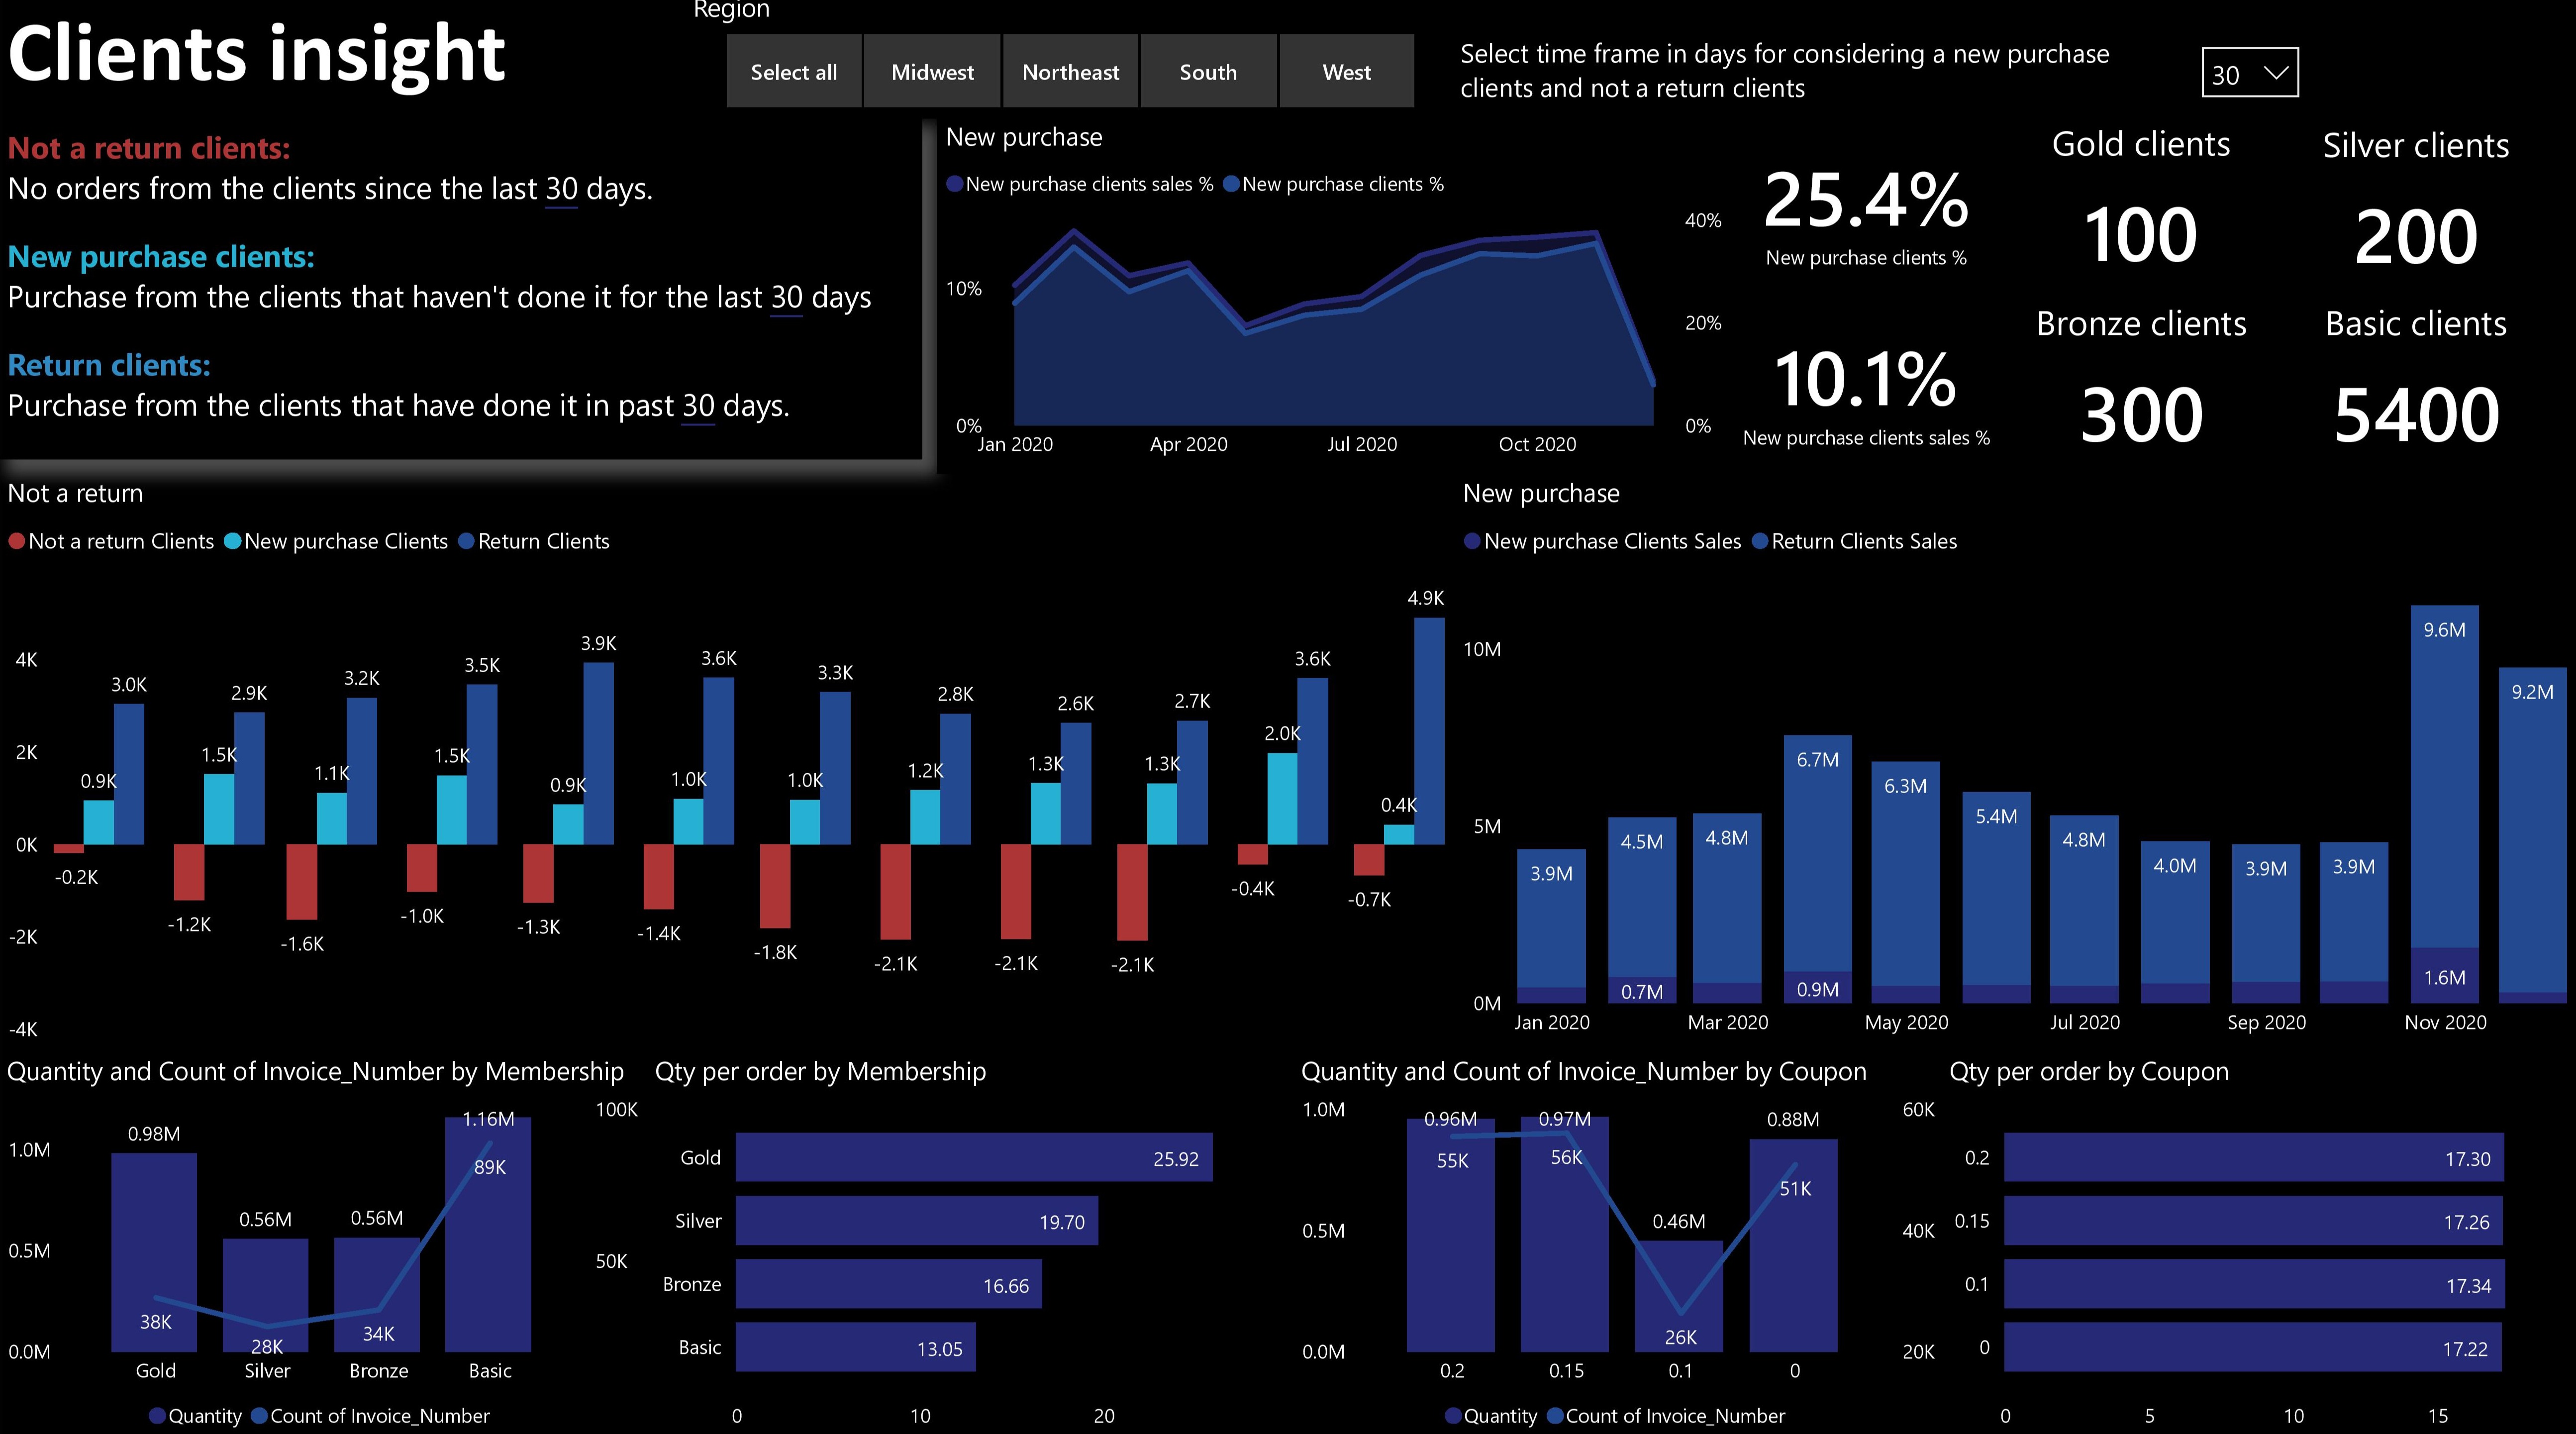
The Marketing Team contacted me and asked me if it's possible to have a dashboard related to the customer buying behaviour as they want to see the impact of the coupon offered especially during the end-of-season, Black Friday and Holidays.
Me:
I emailed to the marketing team that the dashboard is completed and that a drop list is provided to select the time frame in days for considering a new purchase and not a return client.
The text box will be dynamic according to the selecting time frame.
As a clothing company, it's not a product that all customers will buy on a monthly basis.
Finance Manager:
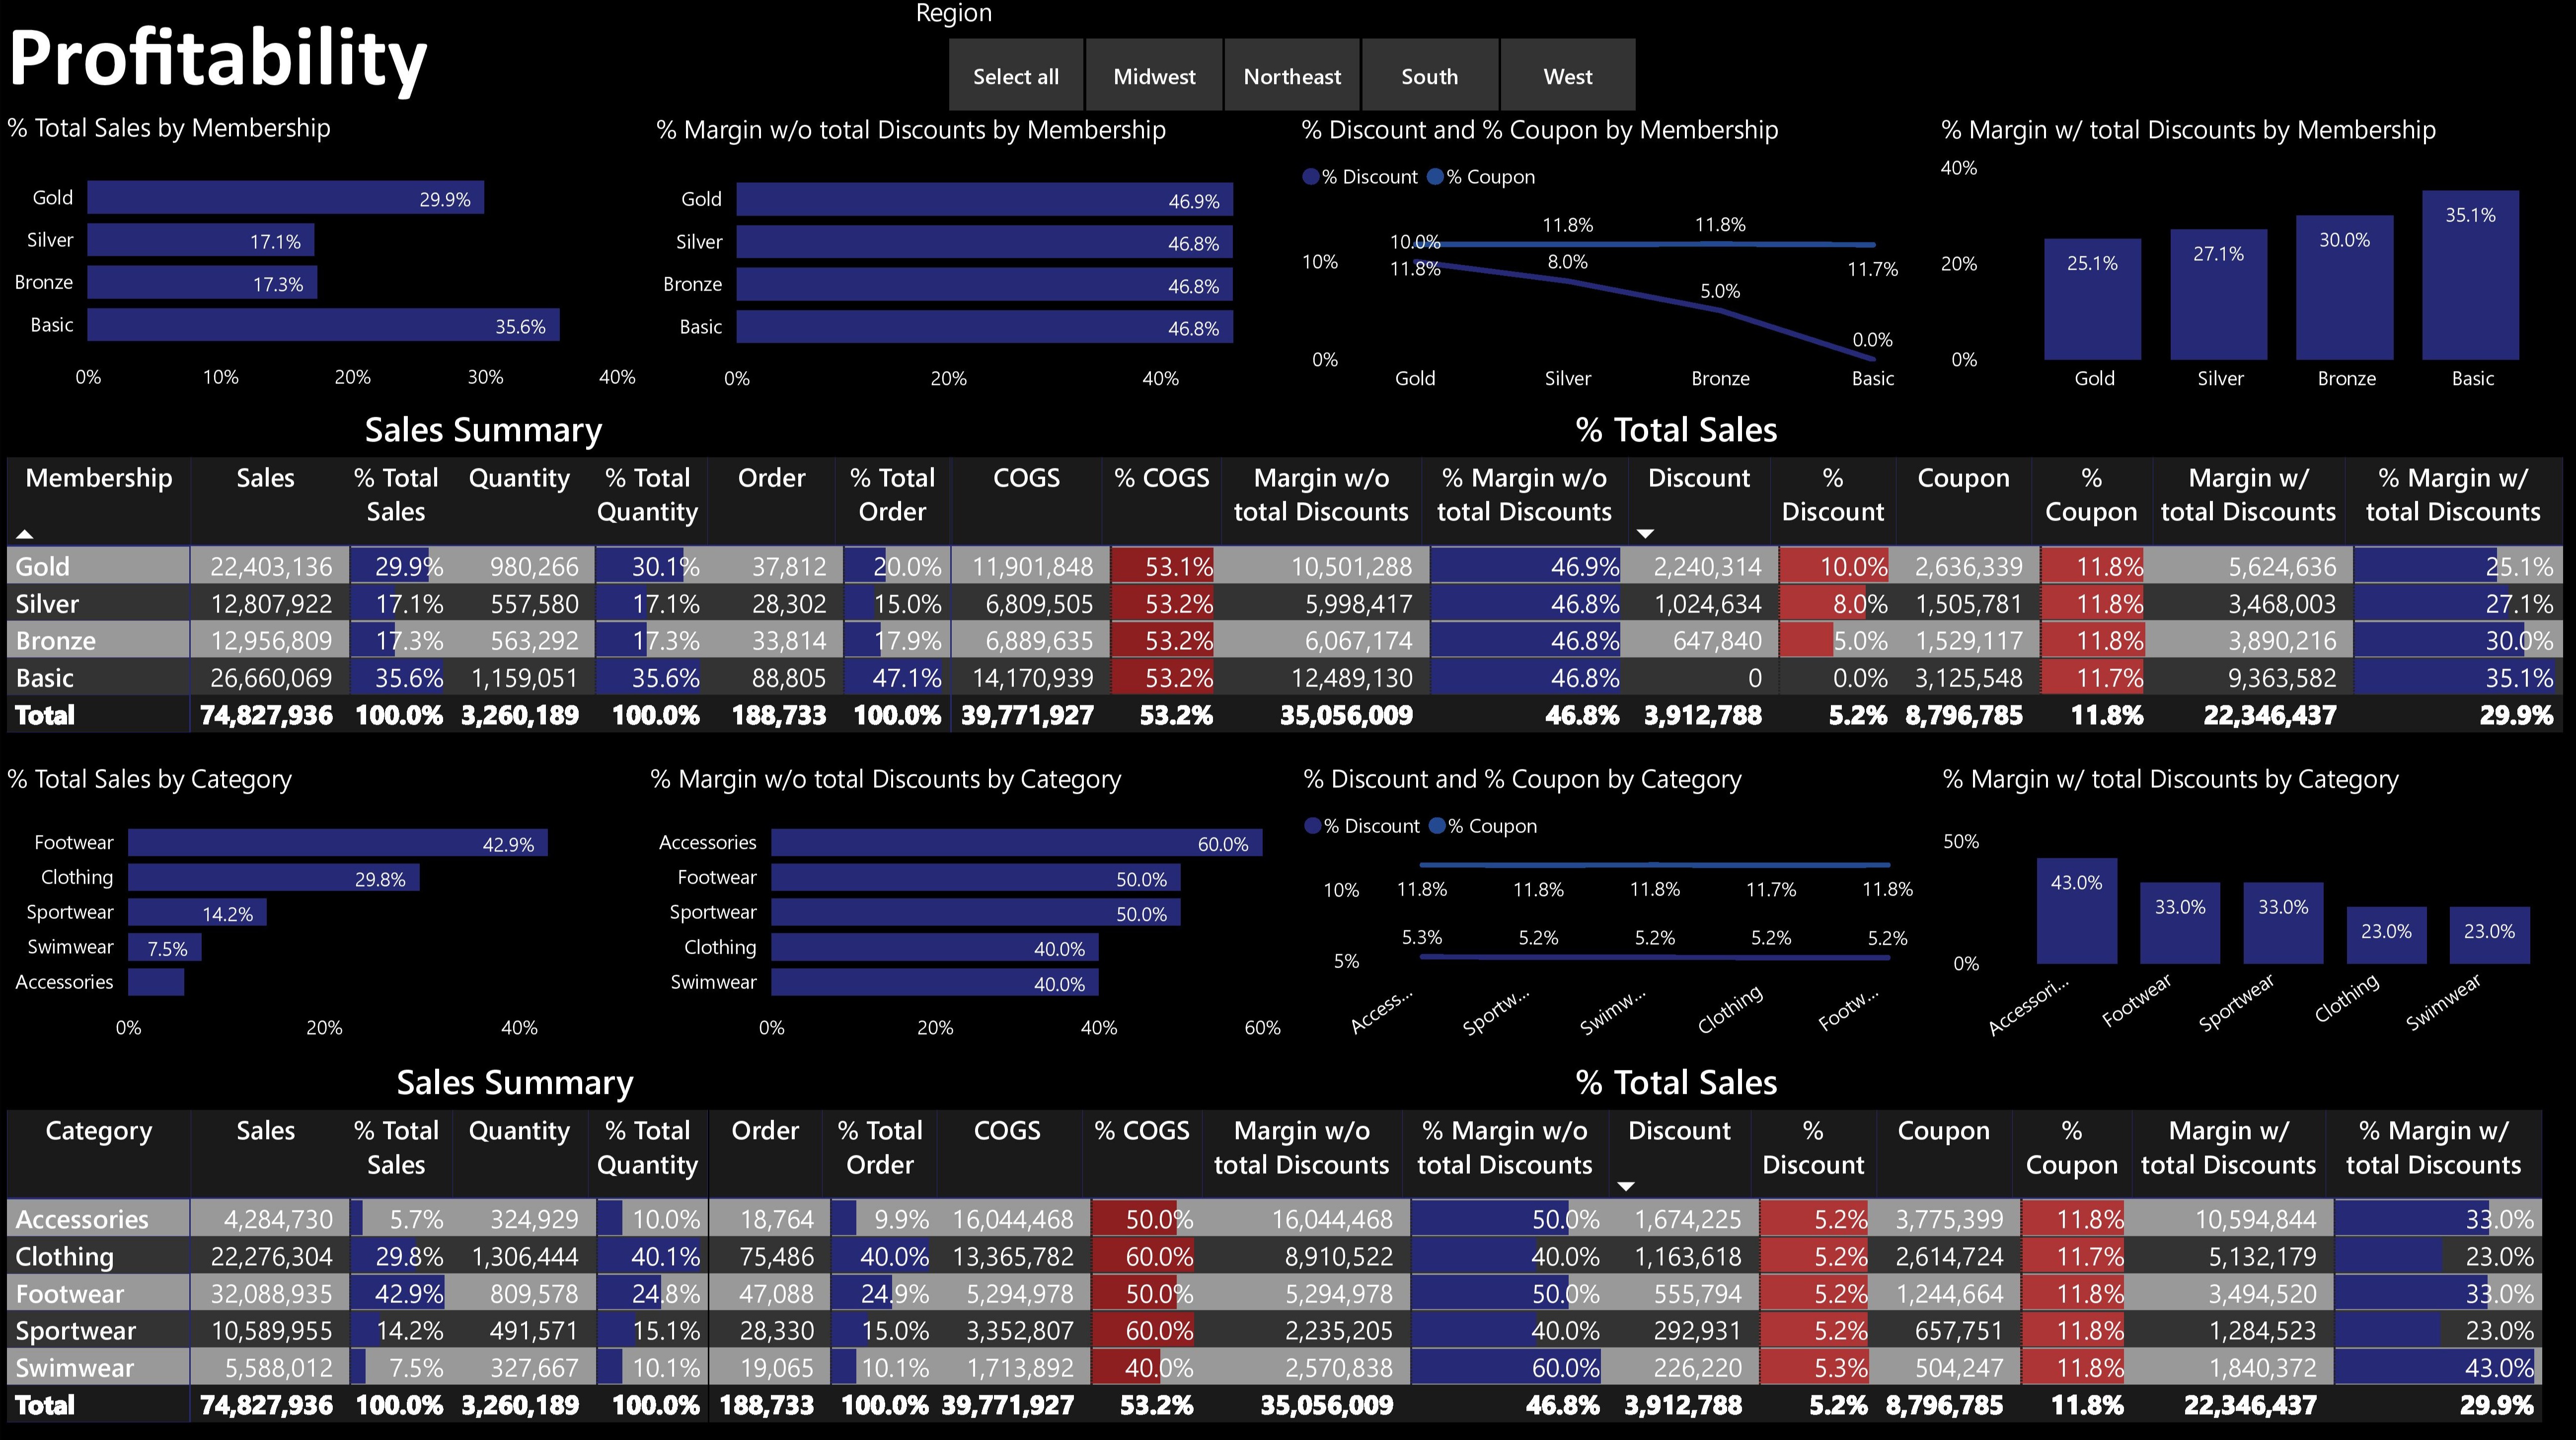
The Finance manager came out of a meeting and asked me if it's possible to create a dashboard related to the profitability per client type and product category.
The product manager and the exec is wondering how much money we are doing as they felt that a lot of coupons was offered to the customers.
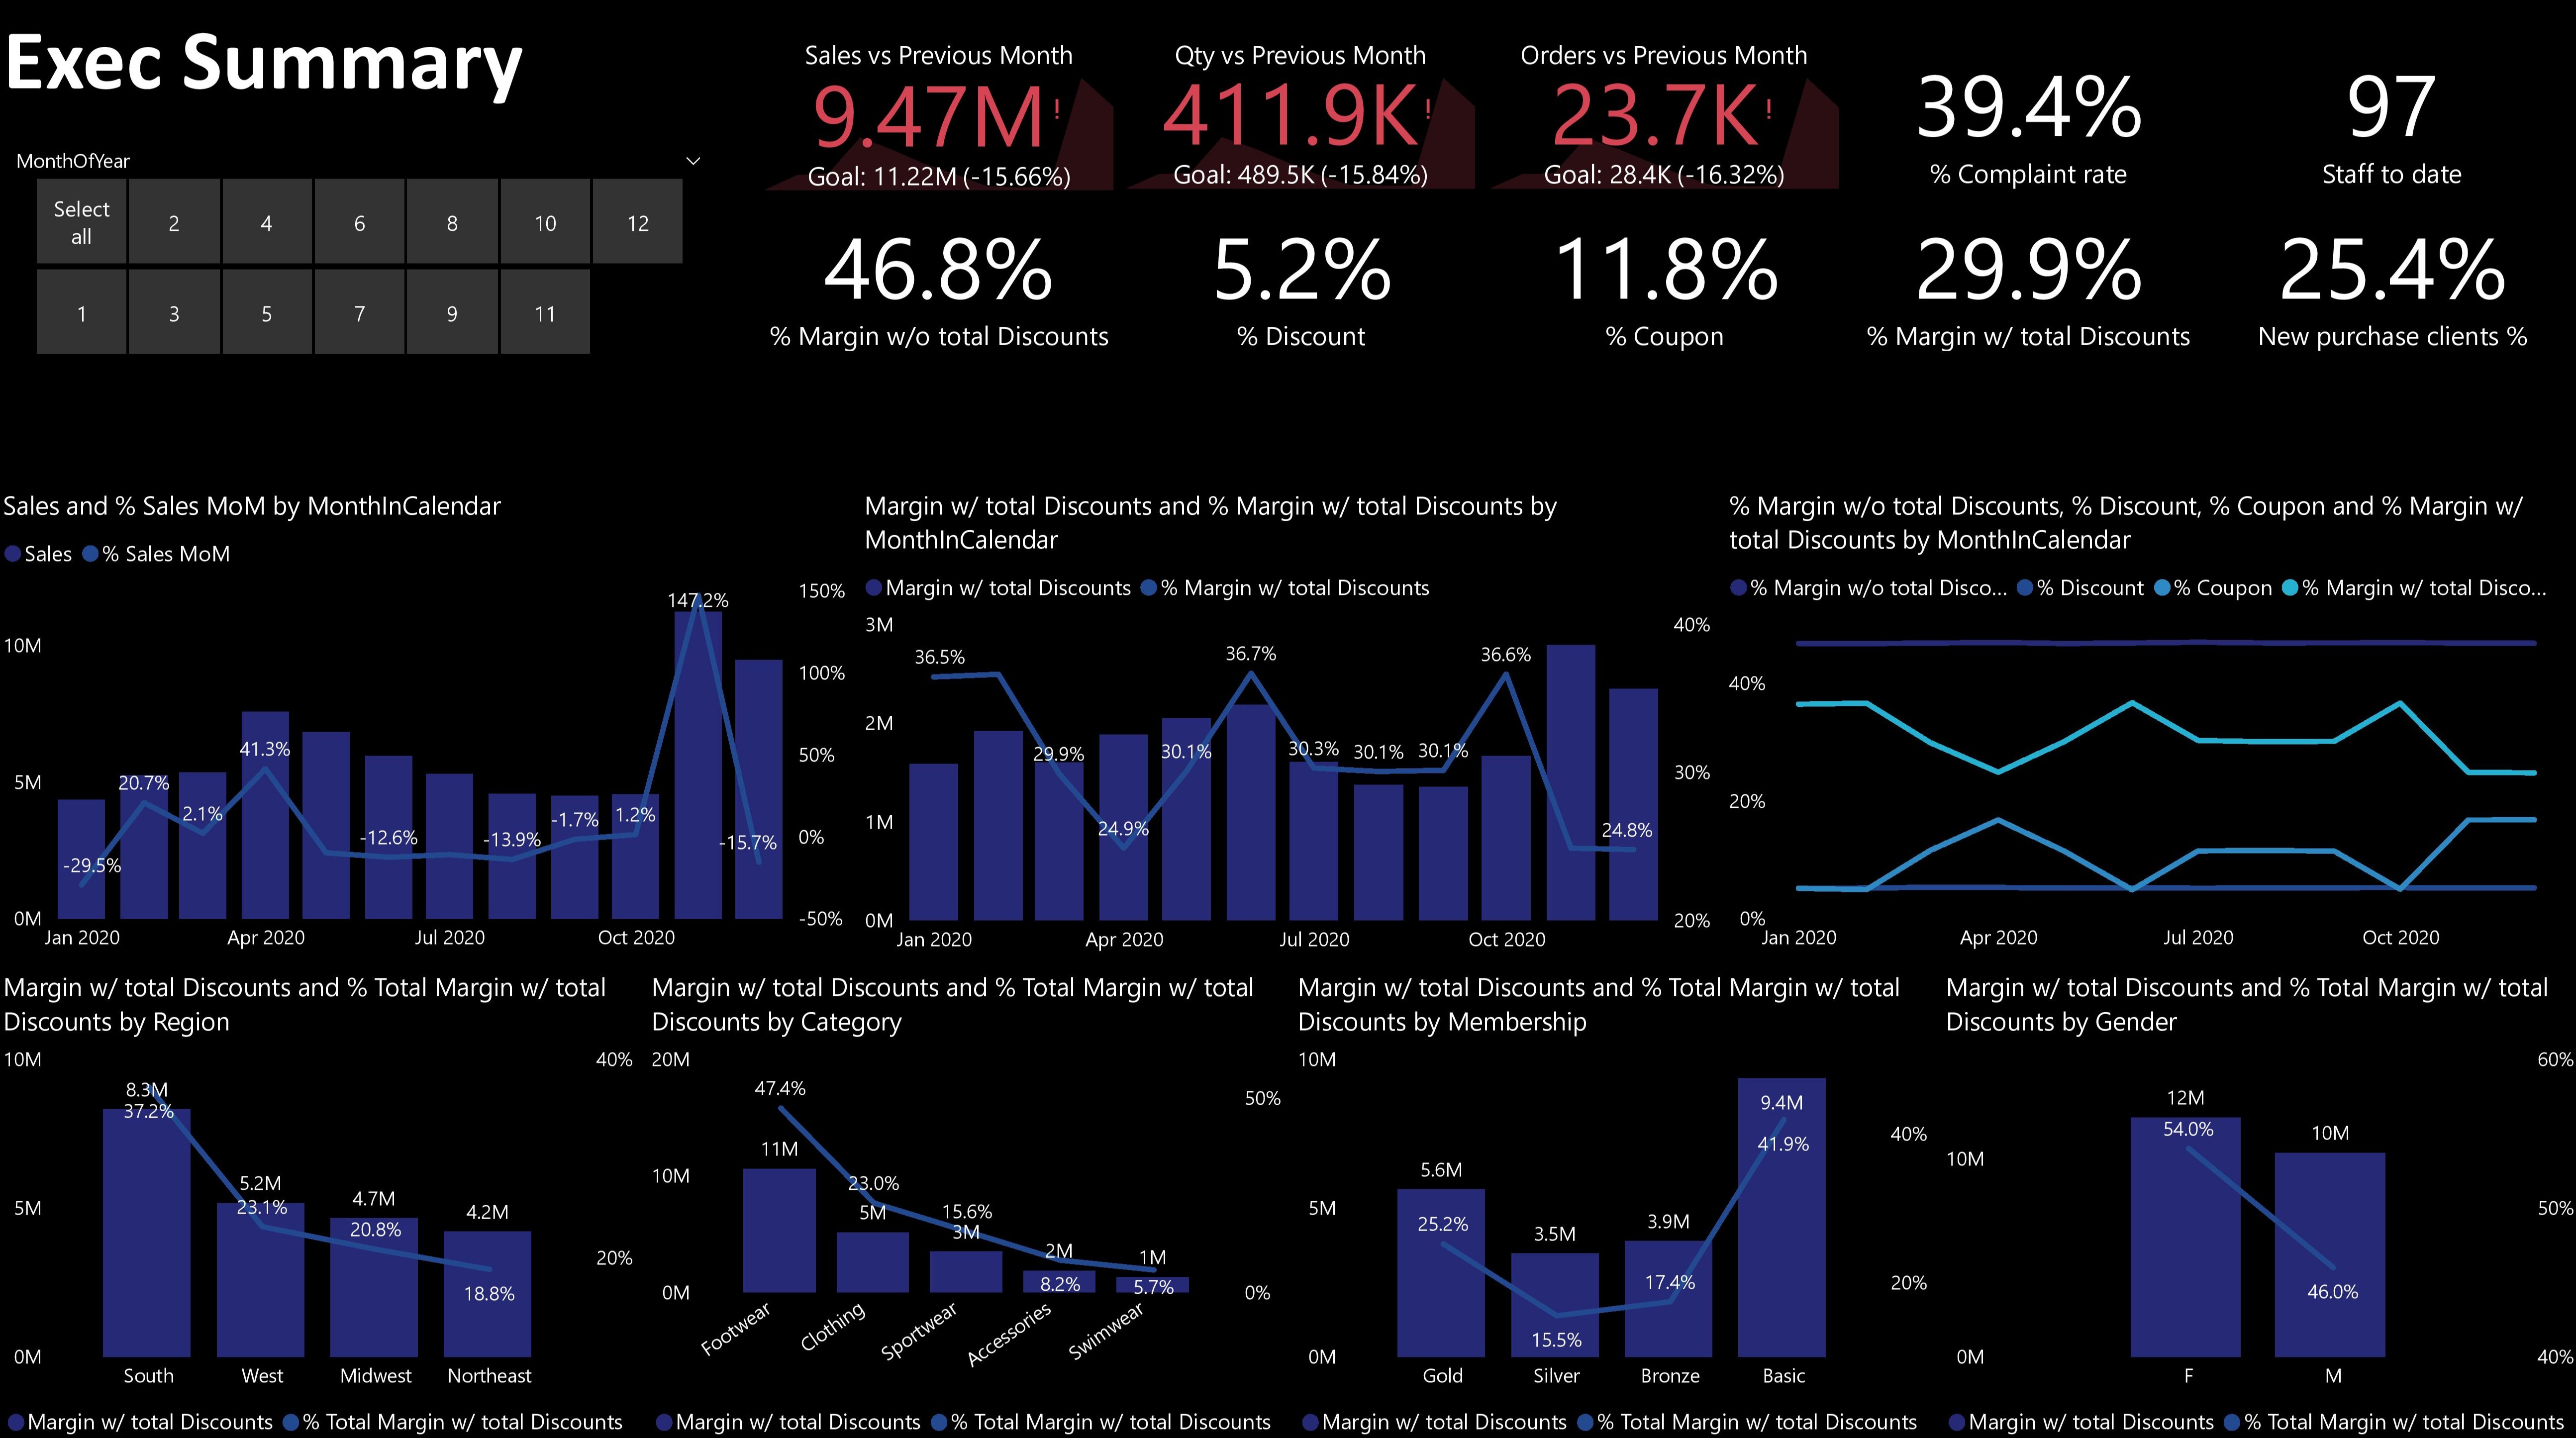
He also added that if that the exec wanted a dashboard that summarize the online sales but with several graphs related to the margin with total discounts.
He concluded that these new dashboard will be useful to prepare the budget of 2021.
Me:
I emailed the Finance Manager that the two dashboards is completed and provided a sales summary and the % Total gross sales for the COGS, Discount and Coupon.
As for the Exec Summary, a Month-over-Month trend in % of the sales is added. A slicer per month is provided to interact with the dashboard.
Finance Manager:
The Finance manager advised me that the product manager and the exec are very impressed of the dashboard.
He asked me if there is any more insights or improvements that we can give to the managers and the company.
Me:
I was happy to know that the product manager and exec liked that dashboard.
Here is the list that I can quickly think that can surely help the company:
- To advise that all dashboard can be improved, and I was more than happy to make the necessary changes according to the needs
- I can see that most of the complaints come from the coupon that didn't work and for the delay of delivery. I can communicate with the warehouse and IT/Marketing department to find the causes. If this issue can be solved, it will surely help the customer support department. Hence, it will save money for the company if less hiring is needed.
- All dashboards will need to be validated or to be updated with the new dataset with the website that the IT will develop.
- The commission calculation and report can be time-consuming according to my colleague, and I'm confident that we can integrate it in Power BI. It will allow all the sales rep to view their sales and commission in real-time.
Here are some ideas that we can do in Power BI:
- Comparing the sales performance of 2021 with the budget
- Create a dashboard for the conciliation of the account receivable and account payable, detailed sales & expenses overview, and all recurring statics financials reports.
- Develop more dashboards by integrating the dataset of marketing, inventory/warehouse, freight/shipping, etc.
- To send a survey to managers, so we can find new insights to provide.
Disclaimer : All content included on this page is for informative purposes only.