Dataset: Microsoft Excel
Dataset source : All content are fictional data and generated in Excel. I created a dataset of 4 years of monthly financial and budget data of 4 Business Units.
Dataset: Microsoft Excel
Dataset source : All content are fictional data and generated in Excel. I created a dataset of 4 years of monthly financial and budget data of 4 Business Units.
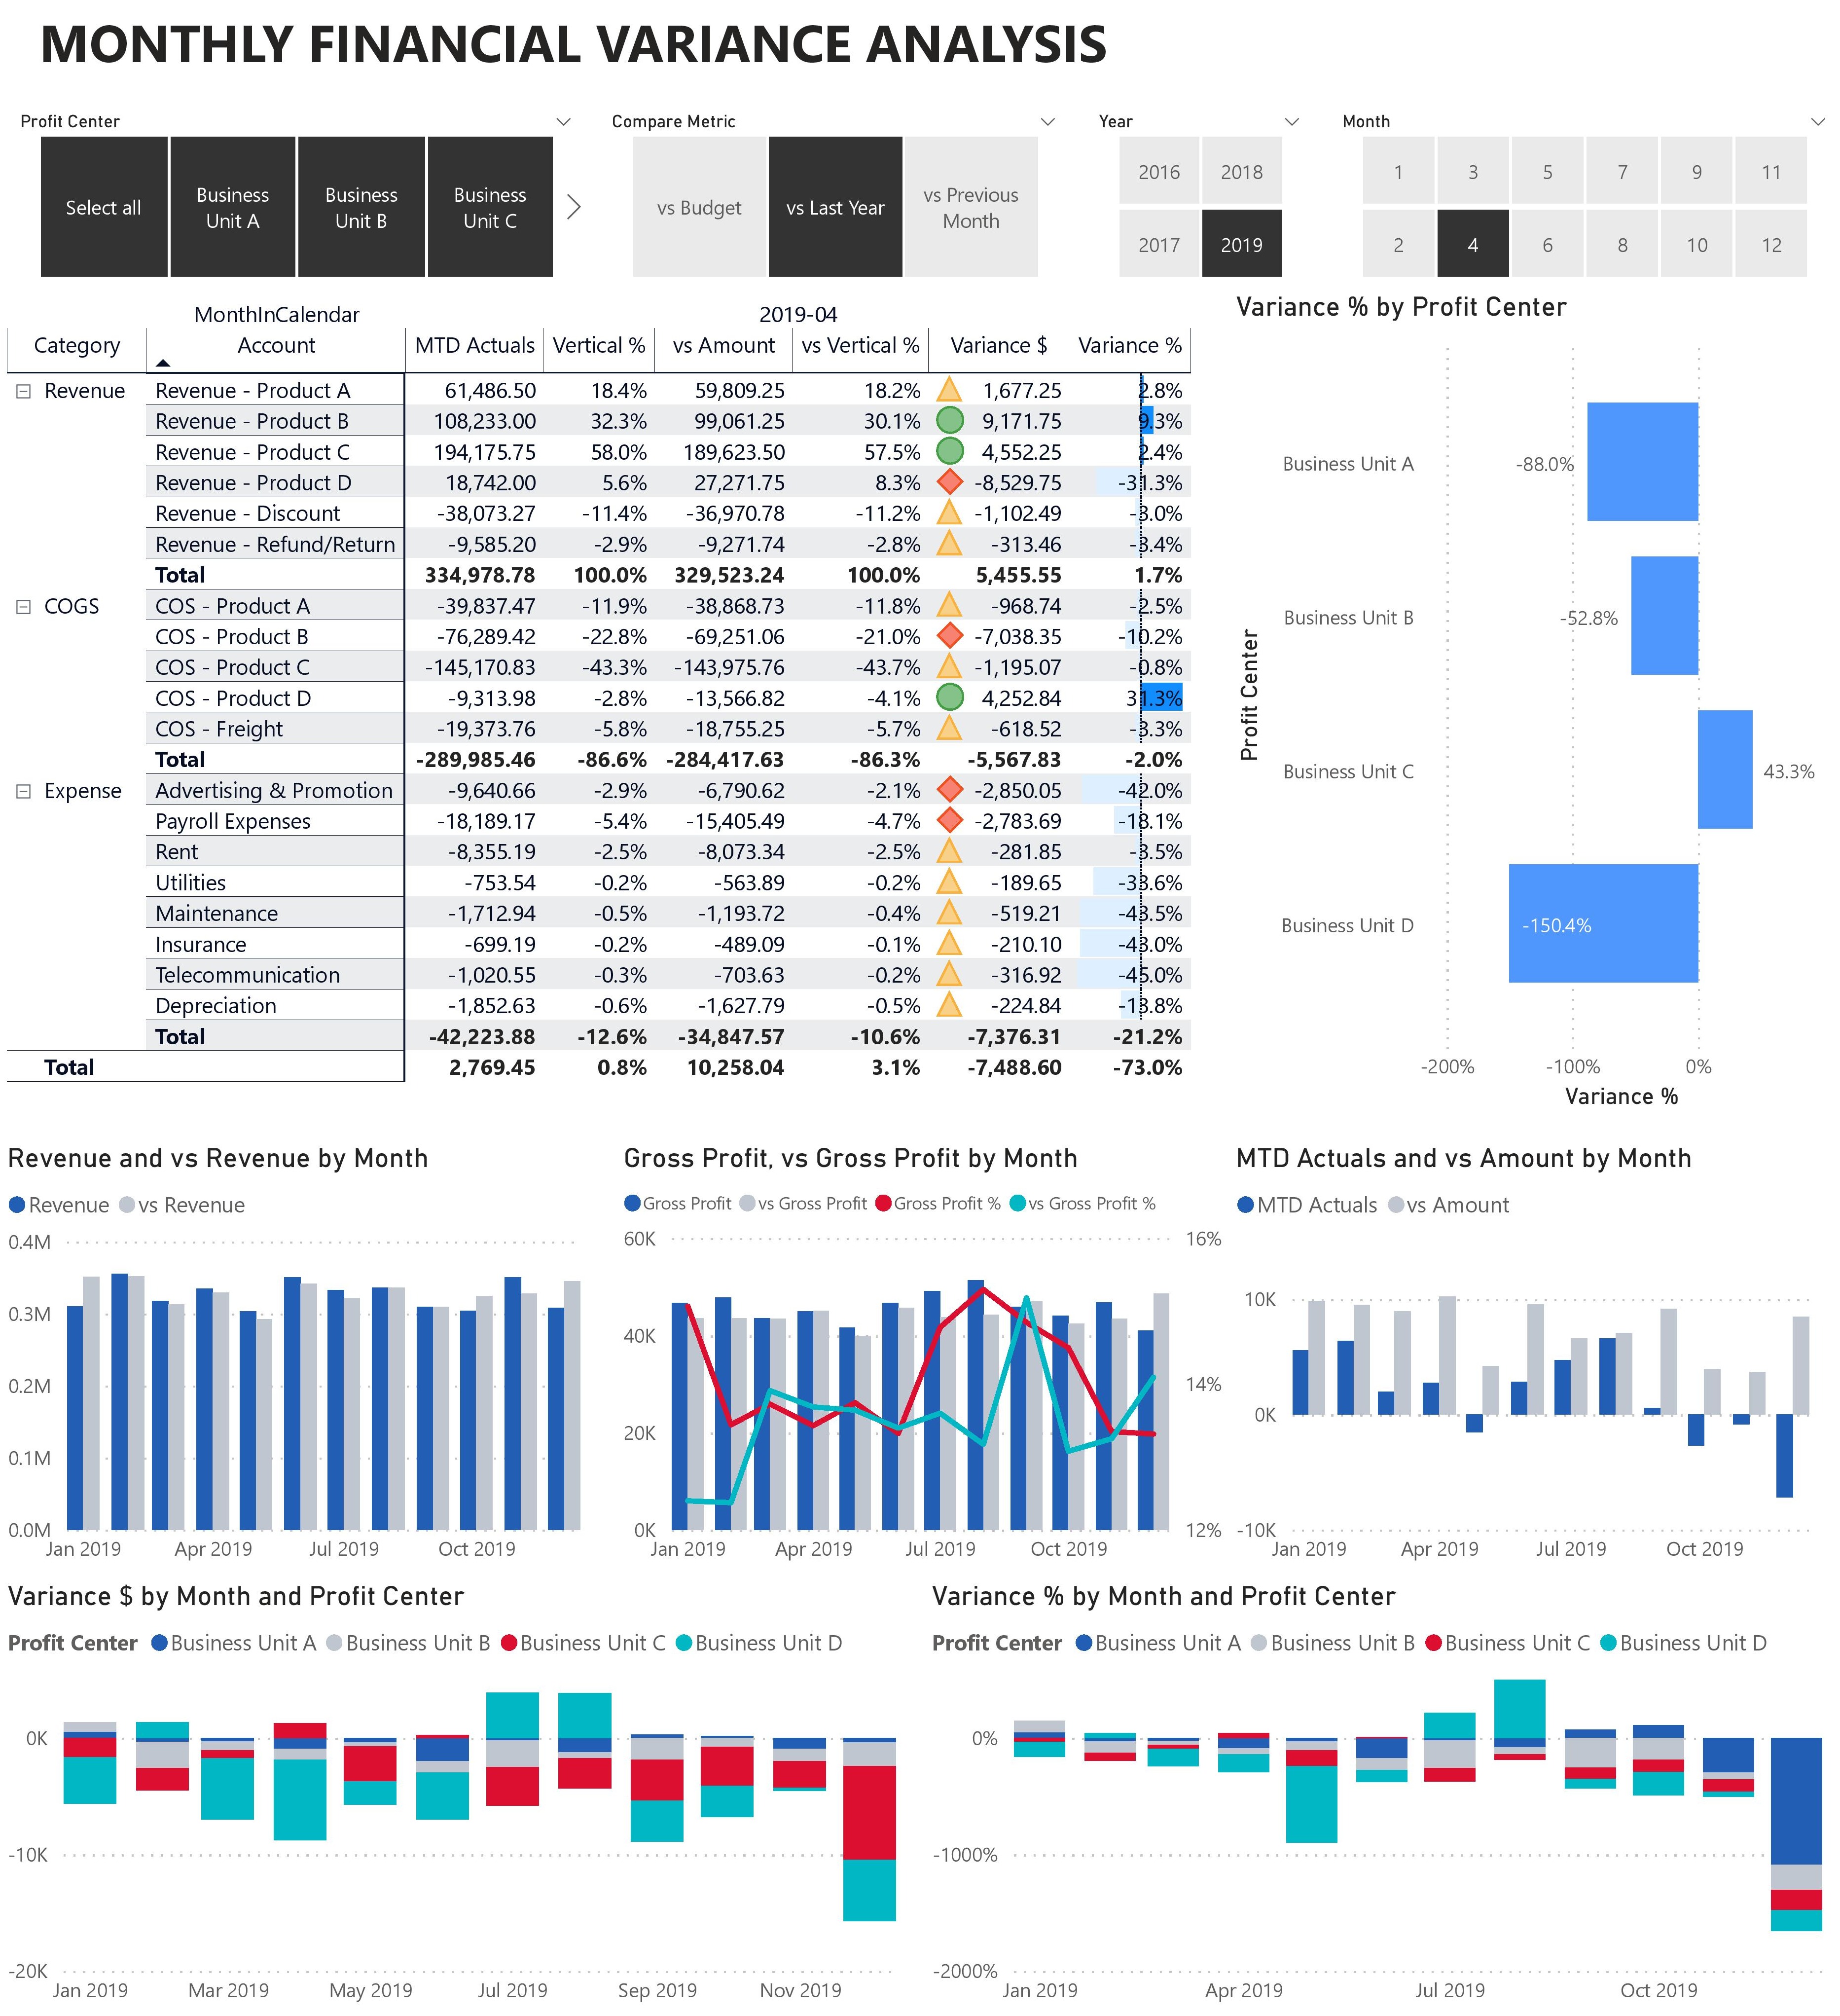
My goal is to turn a static monthly financial variance analysis into a beautiful dynamic data-driven interactive report with Power BI.
Power Query, Power Pivot and DAX was used to build this report in Power BI.
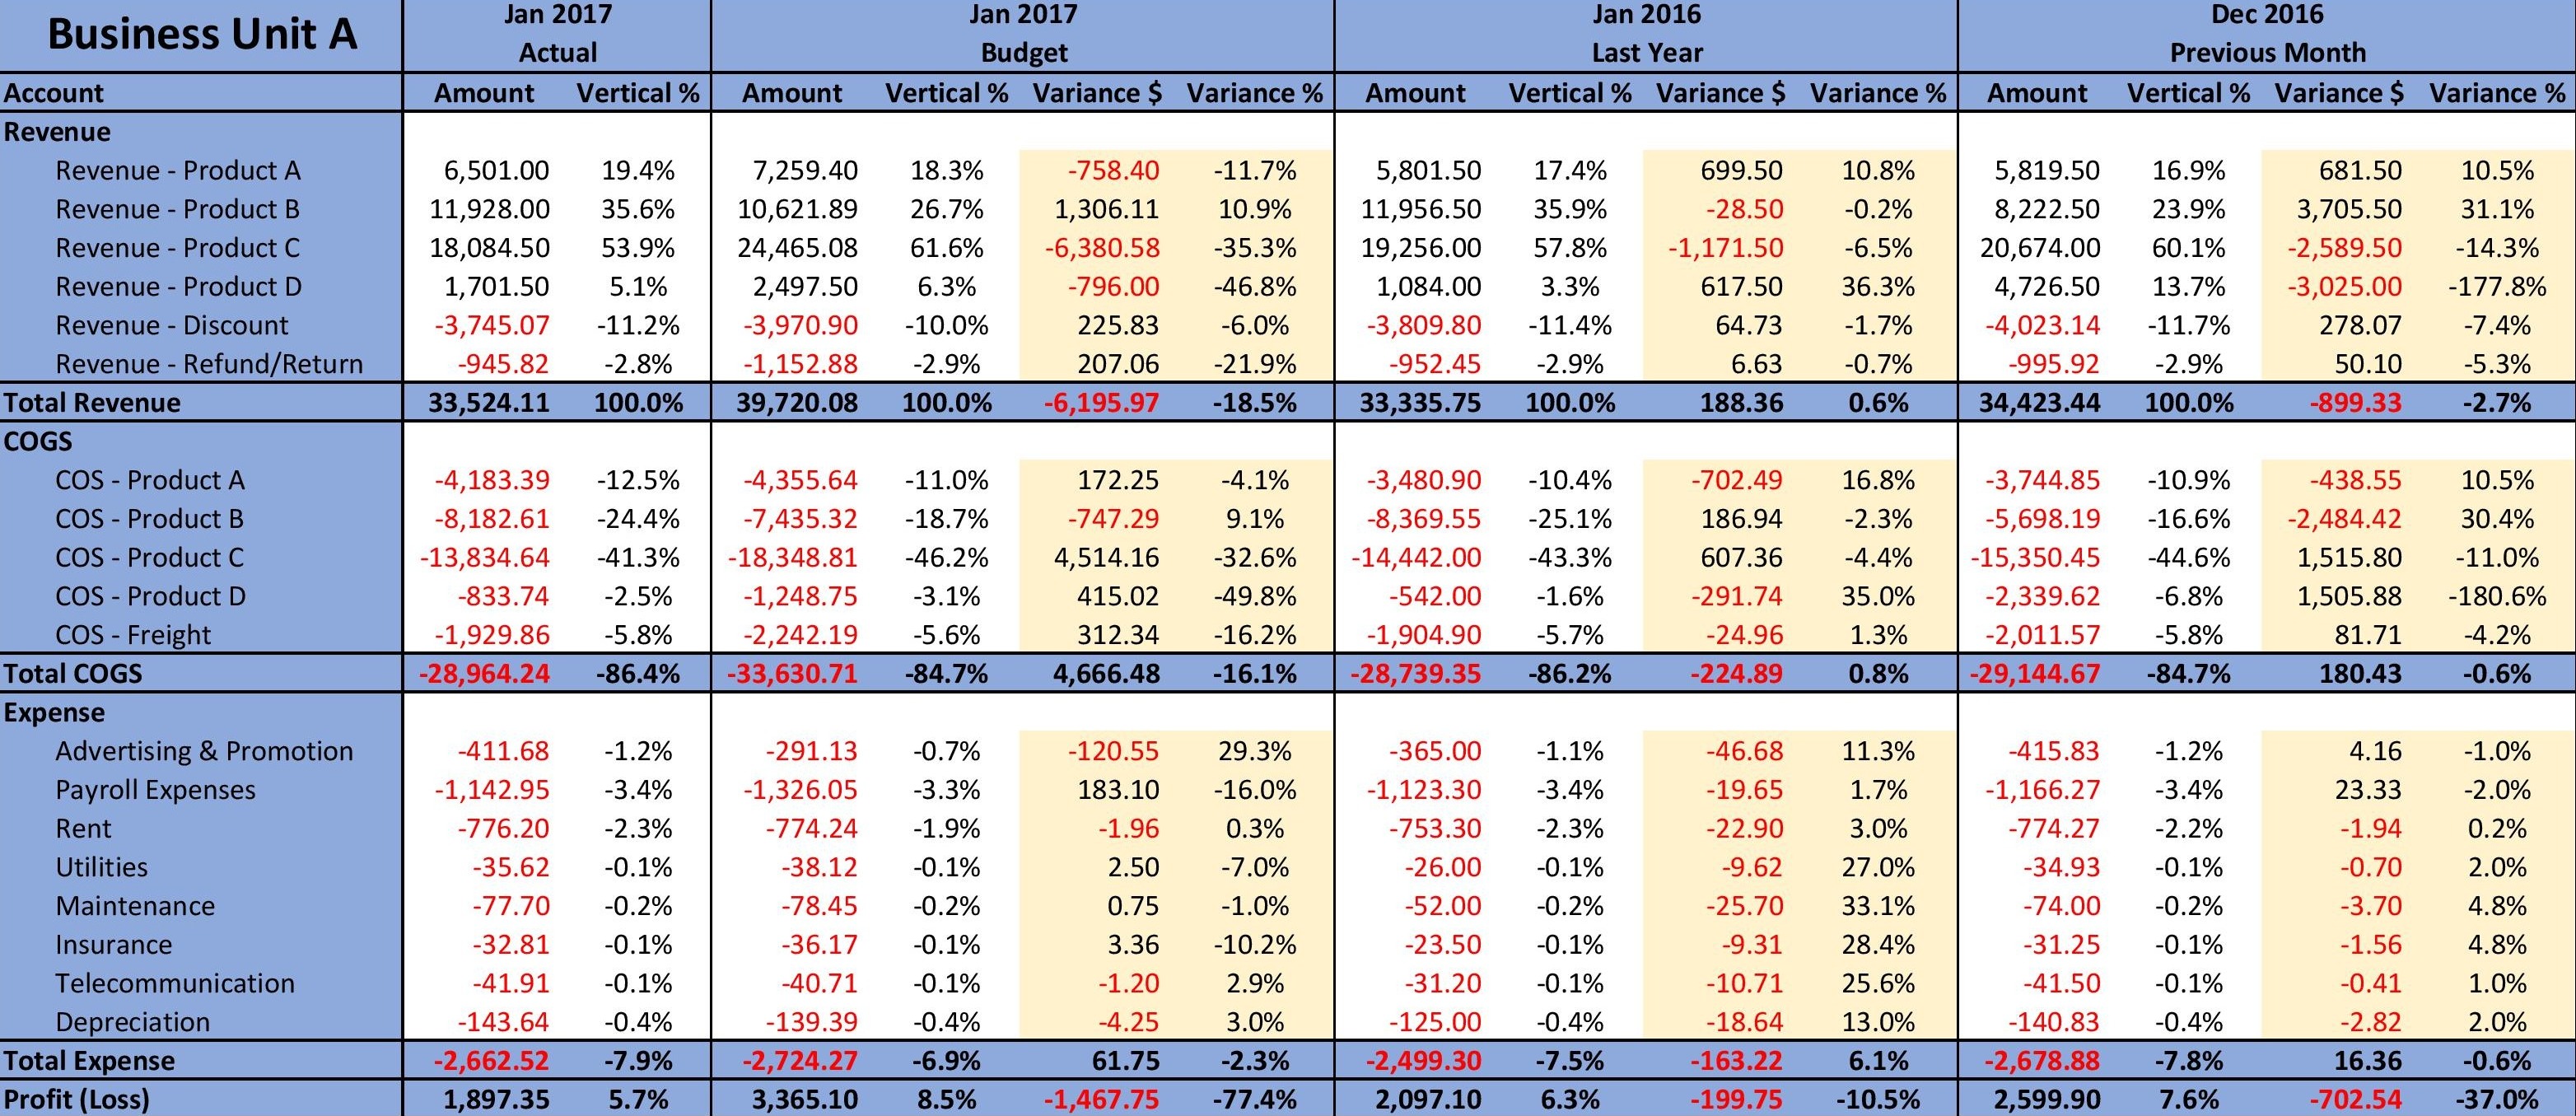
Here's an example of a static monthly financial variance analysis for business unit A.
It's required to have 1 excel sheet per business unit and 1 excel sheet for the grand total of all the business units.
So a total of:
- 5 excel sheets per month
- 5 x 12 = 60 excel sheets per year
- 60 x 4 = 240 excel sheets for 4 years
Disclaimer : All content included on this page is for informative purposes only.